
The Activity Monitor in OS X is one of those unsung utilities that I find indispensable. It allows us to look inside five key areas of our computer to see what’s going on. (This utility exists on all OS X versions since, at least, OS X 10.4.)
Generally, you can’t hurt anything using it because you are simply monitoring your computer. (Well, that’s not completely true, so I’ll tell you the section you need to avoid to prevent messing things up.)
THE ACTIVITY MONITOR
You’ll find this in Utilities > Activity Monitor (or, type Shift+Command+U).
When you open it, it looks like nothing’s happened. That’s because, by default, the main screen is not displayed.
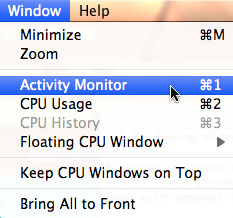
Choose Window > Activity Monitor (or type Command+1). This displays the main window.
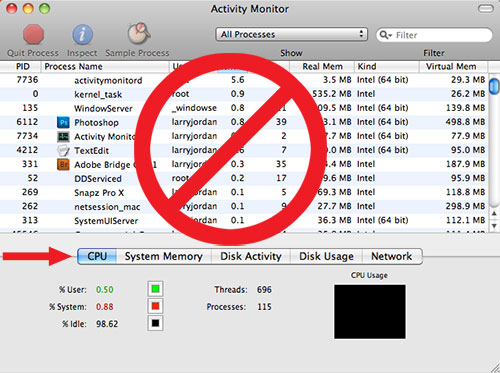
The top portion of the window displays all the processes (think “software”) currently running on your system. LEAVE THIS TOP SECTION ALONE!
There is no problem scrolling through the list at the top to see what’s running, but don’t click any of the buttons at the top, or attempt to change any of these processes, unless you REALLY enjoy watching things blow up!
The part I want to call to your attention are the five buttons along the bottom.
NOTE: A very useful feature of this monitor is that you can leave it open while you are running other software. This allows you watch what’s happening inside your computer while using Final Cut, or Photoshop, or… whatever.
CPU
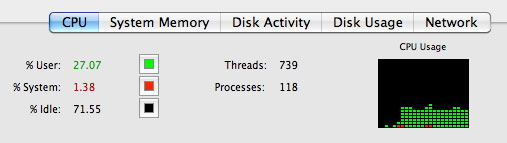
Click a tab to select it. The CPU tab indicates how hard your processors are working.
% User indicates the percent of total CPU capacity that is being used by activities that you have started. In this example, 27.07% of my total CPU capacity is currently busy with applications that I started.
% System indicates percent of total CPU capacity that is being used by the operating system; in this case 1.38%.
% Idle indicates the percent of total CPU capacity that doing nothing, just sitting by the side of the pool waiting for the party to start; in this case 71.55%.
The graph on the right indicates CPU activity over time. More color indicates more activity, more black indicates less activity.

There’s even a floating CPU window (type Command+4 or Command+5 to see the two different versions) that shows how busy each processor on your system is. Green bars indicate busier. In this example, I have an eight processor system. The number of gray bars varies depending upon the number of processors you have. (Rarely will all processors be equally busy.)
SYSTEM MEMORY
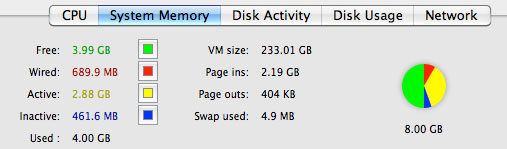
System memory indicates how full your RAM is and how it is allocated. This is an indicator that I refer to a lot. Specifically, I look at the pie chart.
Red indicates the amount of RAM used by the operating system.
Yellow indicates the amount of RAM allocated to and used by software that you have started.
Blue indicates the amount of RAM allocated to, but not used by, software that you have started.
Green indicates the amount of RAM that is neither allocated nor in use.
If your system generally displays all red or yellow pie slices, adding more RAM would be a good thing to improve performance.
If your system generally displays mostly blue and green pie slices, you are not currently using all the RAM you have, so adding more won’t make much difference in performance.
DISK ACTIVITY
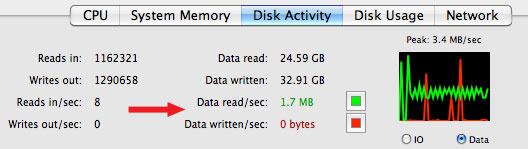
This is another indicator that I refer to a lot. Disk Activity indicates how busy your hard disks are transferring data hither and yon. This displays total data transfer, without regard to which hard disk is doing the work.
The image on the right is useful to see data rates over time, however, I tend to watch the green and red numbers to get more precise readings.
Data read/sec. indicates the total amount of data traffic playing from your hard disk. This is generally measured in either KB per second or MB per second.
Data written/sec. indicates the total amount of data traffic recording to your hard disk. This, too, is generally measured in either KB per second, or MB per second.
Dropped frame errors are almost always caused by a hard disk that is too slow. This tab allows me to see how much data is transferring between my hard disks so I can start to see what data rates are causing problems.
DISK USAGE
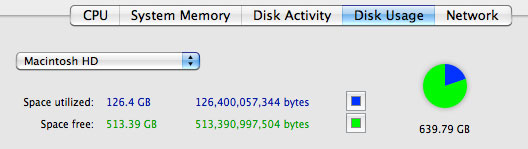
Of the five tabs, I find this one the least helpful. It allows me to see how much space I’m using on each of my hard disks.
While this works fine, I tend to use other methods to monitor how full my hard disks are getting.
NETWORK
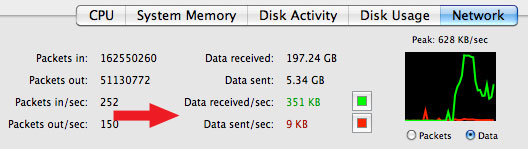
Network is another very useful function. This shows how much data I’m receiving from the network (green) or sending to the network (red).
This is really monitoring traffic over your Ethernet connection. So, in this case, “network” could mean either the Internet or a local server. It helps to get a sense of what data you are using when measuring network activity.
SUMMARY
I find the Activity Monitor a very useful monitoring tool that is often my first stop in trying to figure out where problems are located.
In fact, I talk about it so much to my students, I was surprised to learn I haven’t written about it. So, now, you know, too.

2,000 Video Training Titles
Edit smarter with Larry Jordan. Available in our store.
Access over 2,000 on-demand video editing courses. Become a member of our Video Training Library today!
Subscribe to Larry's FREE weekly newsletter and
save 10%
on your first purchase.
3 Responses to Using the Activity Monitor
Thanks for the info. I passed your article around to my video clique and one of them sent me this link. For $5.99 it seems like a easier/faster/better option than opening Terminal.
http://www.diskrefresher.com/
Wayne:
Disk Refresher is a cool program – they wrote it after reading an article in my newsletter.
Larry
[…] Jordan (the grandaddy of FCP editors) has a useful tutorial on understanding how to use the activity monitor, understanding what its telling you and then what to do about it… If you’ve not done so […]